Alarms
You can display alarms on all elements in the network tree. You can expand alarms layer by layer to determine which cluster, host, or service is experiencing a problem. To see all alarms, examine the Alarms table for the entire network.
Note: Management Station alarms are only visible at the Nuance Network scope. These are identified as MSERVER in the Alarms table.
Alarm definitions
The different alarm classifications (minor, major, critical) are based in part on the component’s ability to recover to a fully functioning state. For a host or service, that can mean the ability to take calls. For Management Station, that can mean the ability to perform tasks like import call log files or summarize call log data for report generation.
A minor alarm is temporary and the component generating the alarm generally recovers automatically. No immediate administrator attention is required. A critical error, on the other hand, is always permanent and requires immediate administrator attention to diagnose and resolve the problem.
Table of alarm definitions defines the different alarm levels. The definitions show the impact on callers (“caller-affecting”), as well as the impact on Management Station (“MS-affecting”). As you can see, the definitions for minor and critical alarms are straightforward and distinct. The definitions for major alarms are less so. Sometimes they are temporary and automatically recoverable (for example, a certain service goes down but comes back up). Sometimes, they are permanent and require an administrator’s attention (a log import task fails, the administrator has to free up disk space).
As a general rule, investigate alarms as they occur.
|
Alarm |
Definition |
Examples |
|---|---|---|
|
Minor |
|
|
|
Major |
|
|
|
Critical |
|
|
If using Red Hat 8 Enterprise Linux in a distributed environment, a major alarm "NLE client not trusted" can appear. This is caused by differences in the clock time between servers. The solution is to synchronize the clocks by downloading, installing, and enabling a tool such as the chrony package. The Chrony NTP clients will synchronize the hosts, and the alarm will not appear.
Investigating alarms
When an LED indicates an alarm, examine the alarm message to determine the corrective action. To do that:
- Select the scope in the tree view: Nuance Network, cluster, host, or service.
- Click Alarms on the toolbar. The Alarms table appears showing all the alarms at the scope. For example:
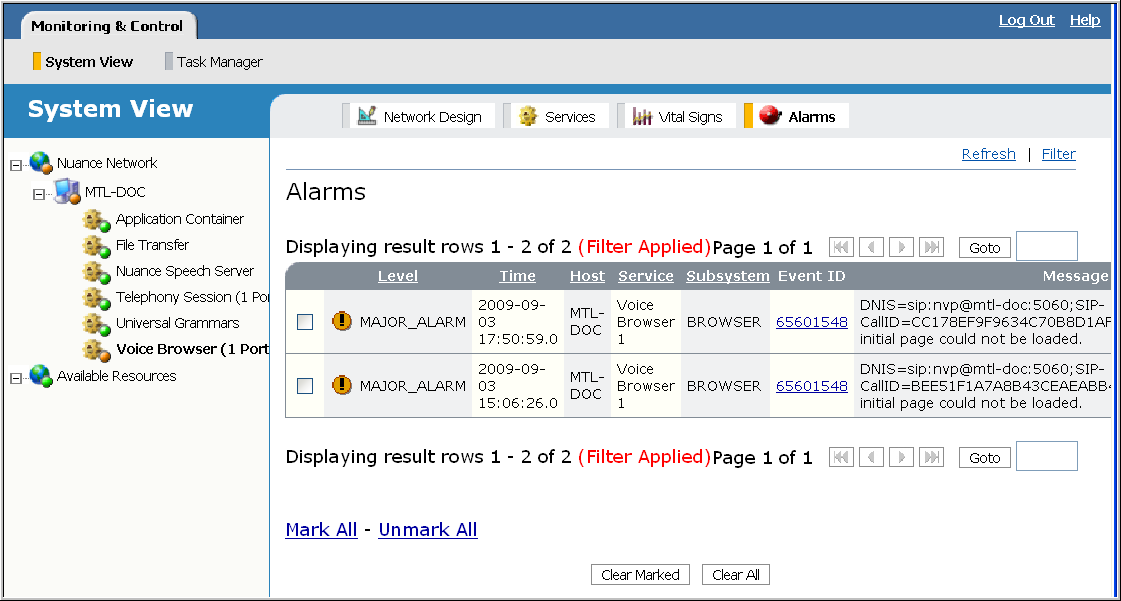
The fields you see are the various message components comprising the log output generated by the alarm, for example, the severity level, the time the message was generated, the message text, and so on.
The Alarms table shows alarms at the specified severity and higher. The default filter for viewing alarms is MINOR_ALARM, meaning MINOR_ALARM, MAJOR_ALARM, and CRITICAL_ALARM events are filtered from the database to appear in the table.
- Click a column heading to sort entries by that column. Click it again to revert to the original order.
- You can use the navigation links in the upper right corner to quickly advance to different pages. To move to a specific page, enter the number in the Goto box.
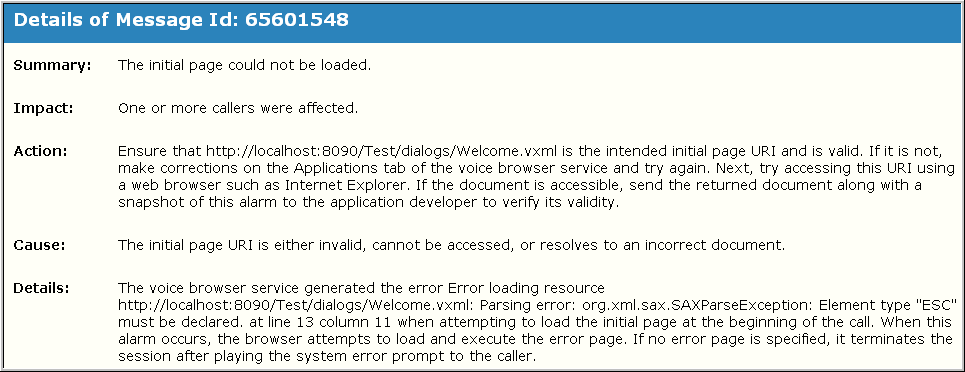
- You can view details about each alarm, including actions to take to correct the problem. Click the Event ID for an entry (may not be active for all alarms. The alarm details appear in a message window. For example:
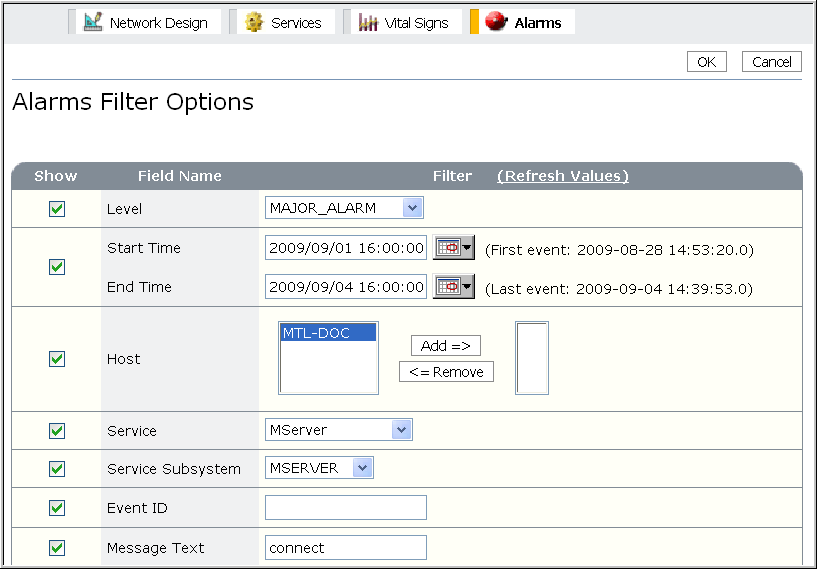
- Click Filter in the upper right corner of the Alarms table to change the alarms or fields that will appear. The Alarms Filter Options page appears. You can specify any number of filtering and viewing options.
Note the following:
- In general, Management Station makes an exact match for user-supplied fields.
- Fields with drop-down lists are dynamically populated. Management Station queries the database to find all possible values and caches them in memory. If you think the database contents have changed, click Refresh Values to update the lists.
- Filters are applied temporarily for that scope. The alarms table display reverts back to the original settings once you select another scope from the network tree.
The fields are:
- Level: The alarm logging level. For example, to see only the major and critical alarms, choose MAJOR_ALARM.
- Start and End Time: Specifies the time range on which to filter alarms. Only alarms generated within that range appear in the table.
If you specify just a start time, then only alarms with this timestamp and later are displayed. Conversely, if you specify just an end time, then only alarms with this timestamp and earlier are displayed. If you don’t specify a timestamp, then all logs are displayed, regardless of their timestamp.
- Host: Host where the alarm occurred.
- Service: Service generating the alarm, for example, MServer (Management Station)
- Service Subsystem: Internal component name that generated the alarm, for example, MSERVER.
- Event ID: Unique identifier for the alarm.
- Message Text: The alarm text provided by the application. You can supply a substring. Management Station will find all occurrences of that substring. The comparison is case-insensitive.
For example, to see all alarms containing the substring connect as part of the message text, type connect in the Message Text field. Management Station returns all occurrences of that substring, for example: Failed to connect, ERROR_CODE_CONNECTION_FAILED, and so on.
- Service ID: Unique identifier for the service that enables Management Station to map diagnostic logs to a particular service. When a service is restarted after a failure, it keeps the same service ID.
- Internal Source: Class name, method name, or line number where the alarm was generated.
- Thread ID: Identifier assigned by the operating system to each running thread of a service.
- Session ID: Unique, global identifier generated automatically by the telephony session service on incoming calls and propagated to other services like the voice browser service and Speech Server during the current call. By using the session ID, you can correlate log files generated during a particular call. On outbound calls, the session ID is generated by the voice browser service and propagated to the other services.
For example: 0a032713_00004677_4cd314ab_0638_000c
The value is a hexadecimal representation indicating:
Host IP address
IP address of the machine answering the call
Process ID
OS-specific identifier for the process, uniquely identifies the process relative to the host
Timestamp
Number of seconds elapsed since Jan. 1, 1970
Instance
Per-process unique identifier, uniquely identifies the call relative to the process
Channel ID
Application-specific value (zero, if automatically generated), used in troubleshooting
If the session ID is not available, it appears as "-" in the display.
- Number of Event per Page: Maximum number of alarms displayed on a page. The limit is 100.
- Maximum Number of Hits per Query: Maximum number of alarms retrieved from the database for display. To avoid memory exception errors, Nuance limits the maximum number of hits per query to 10,000.
- When done, click Apply. The modified alarms table reappears.
Clearing alarms
Alarms must be regularly managed. Some guidelines are:
- Investigate and clear alarms from Management Station Alarms table as they occur. By regularly clearing alarms from Management Station, you avoid possible out-of-memory problems.
- You must manually delete alarms from Management Station, even if they are automatically recoverable. Check specific ones and click Clear Marked, or click Clear All. Once all the alarms have been cleared, the alarm indicators change back to green.
- The Clear All button clears the maximum number of alarms retrieved from the database for display (Maximum Number of Hits per Query).
- After a Clear All, you might still see alarms displayed in the alarms table. This happens if the number of alarms generated in the system exceeds the maximum number of hits in the query. For example, say you set the maximum number to 1,000 but the database contains 1,800. Clicking Clear All deletes the 1,000 alarms that are displayed, but the remaining 800 alarms in the database will now appear in the alarms table. Click Clear All again to clear the remaining alarms.
Note: Clicking Clear All locks the alarms table for all users until the task has completed.
When you clear alarms from Management Station, they are deleted from the database. However, alarm messages are also written to an alarms history log file located under %NUANCE_DATA_DIR%\system\alarmsArchives. If necessary, you can still look them up in this file.
Each field of alarm_history.log is separated by a "|" and each key/value pair is separated by an "=". For example:
Timestamp=2009-09-01 16:58:59.720|Added Alarm :: Level=MAJOR_ALARM|Host=MTL-DOC|Service=Voice Browser 1|Subsystem=BROWSER...Message Text=...The initial page could not...
The timestamp indicates the date and time (based on a 24-hour clock) the alarm was generated (added to) or cleared from the Alarms table. The format is: YYYY-MM-DD hour:minutes:seconds:milliseconds. The other fields indicate the alarm level, the host on which the alarm occurred, the service generating the alarm, and so on.
You can configure certain aspects of alarm logging by setting properties in %MSTATION_HOME%\mserver\webapps\mserver\config\mserver_cfg.properties:
- Set storeAlarmHistory to false to disable alarm-history logging. Default is true.
- Set maxAlarmHistoryFileSize to the maximum size of the log file before it rolls over and a new file is created. Default is 50 MB.
- Set maxBackupAlarmHistoryFiles to the maximum number of backup files to keep. Default is 5.
Purging alarms automatically
Management Station is configured to automatically purge alarms on a regular basis. You might find this useful if an excessive number of alarms are being generated or you receive exception errors when manually clearing alarms (using Clear All). You still have the option to manually clear alarms.
This feature is enabled by default.
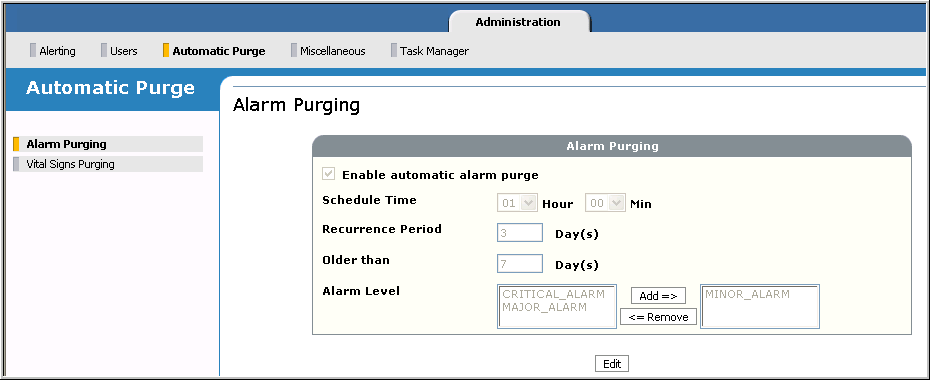
To configure automatic alarm purge, display the Alarm Purging page, available from Administration→Automatic Purge. For example:
- Click Edit to modify the default settings:
- Enable automatic alarm purge: Uncheck to disable automatic alarm purge. Default is enabled.
- Schedule Time: Specify when to run the automatic alarm purge task. The default is 1 a.m (01:00). The time is for the current day. If it’s December 18, a schedule time of 00:00 means midnight, December 18, 01:00 means 1 a.m., December 18, and so on.
This means that depending on when submit your changes, an automatic alarm purge could run immediately since the scheduled time has already passed.
Note: Be cautious when scheduling tasks to occur during the skipped hour on the first day of daylight savings. Management Station automatically reschedules tasks set to run during that missing time to an hour earlier, which can overlap with other scheduled tasks.
- Recurrence Period: Specify how frequently to run the automatic alarm purge task. The default is every 3 days.
- Older Than: Specify the time period after which alarms are purged. The default is 7 days. For example, to purge alarms older than 3 days (from the time they were generated), you would change the setting from 7 to 3.
The current day is included in the calculations.
- Alarm Level: Add the alarms to be purged. The default is MINOR_ALARM. For example, to purge major and minor alarms, add MAJOR_ALARM.
- Click Submit. Management Station displays a results page with your settings.
After you set these fields, Management Station is configured to “wake up” at the scheduled time according to the recurrence setting, check the timestamp on the specified alarms collected, and purge any older than the number of days specified.
For example, if today is December 18, 2008, and you’ve specified to purge minor alarms older than 3 days starting today, then all minor alarms generated before December 16, 2008 00:00 are purged. The current day is always included.
If Management Station doesn’t find any alarms that satisfy this condition, it goes back to sleep. A non-editable task appears in the Scheduled Tasks list of the Task Manager that shows the date and time of the next purge.
Alarm catalog
For a list of the alarms set by all services, see AlarmCatalog.html, located under %MSTATION_HOME%\mserver\webapps\mserver\data\message-catalogs\1.0. This catalog, auto-generated after installation, includes alarm messages for all services used by Management Station.
