Monitoring performance and alarms
Using the Management Station performance and fault managing features, you can quickly assess if your system is performing optimally: for example, if performance thresholds have been breached, or if any services are behaving abnormally.
This topic describes how to:
- Monitor system performance: View the operational status of managed hosts and services.
- Monitor vital signs: View performance statistics on various aspects of the system every several seconds.
For information on viewing shared-memory data on hosts configured to run multiple recognition services, see Accessing shared memory details.
Monitoring system performance
Monitoring system performance consists of two basic activities: measuring performance, then analyzing it.
Measuring performance means gathering statistical data maintained by hosts in the managed network. This data tracks internal activity like system CPU and memory utilization, and different call statistics like response time, recognition time, and so on. Analyzing performance data means to make sense of it, see trends, and find ways to improve the performance.
The Management Station periodically collects performance data from managed hosts. The Management Station also regularly pings each host to determine whether the host and its services are running or have generated any alarms. Alarms are sent to the Management Station in real time.
The Management Station displays the performance data as graphs and the operational status as LEDs for an at-a-glance assessment of the overall system health. The display is updated every several seconds giving you a current glimpse of your system as events occur.
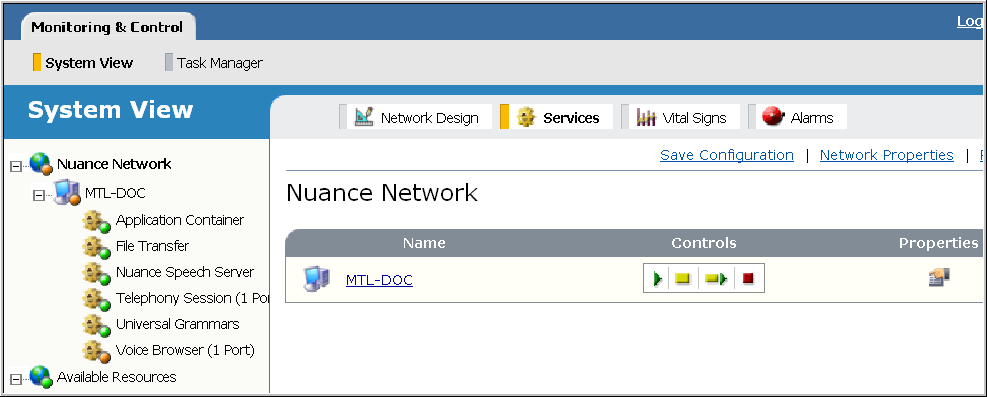
Viewing operational status
To view the operational status of managed hosts, follow these steps:
- Click the Monitoring & Control tab.
- Click System View. All configured hosts appear in the left frame.
- Expand the tree view for one of the hosts. All configured services for that host appear.
Each element in the network tree displays an LED indicating its operational status. Based on the color code, you can quickly determine if the hosts and services are online, if any alarms have been generated, and if so, the severity of the alarm. Nuance defines three alarm levels: minor, major, and critical, which appear in the Management Station as yellow, orange, and red. See Alarms.
For example:
The LED colors mean:
- Gray—Configured but not running (offline).
- Green—Online and no alarms.
- Yellow—Minor alarms, the system encounters an error that briefly and partially affects a service instance or host.
- Orange—Major alarms, the system encounters a serious error leading to the loss of a service instance.
- Red—Critical alarms, the system encounters a catastrophic failure leading to the complete loss of a service or set of services.
- Nuance Network LED—Shows the status of the most severe alarm that has occurred in the system, including any alarms on the Management Station host (which does not appear in the tree view).
The network tree display refreshes every 10 seconds. To change the timer, see the User Preferences page (see Modify user preferences).
Monitoring vital signs
The Management Station displays performance data on various aspects of the system every several seconds. These statistics, called vital signs, are displayed for the network, cluster, host, and service scopes.
To view the vital signs, follow these steps:
- Click the Monitoring & Control tab.
- Click System View.
- Select the scope from the network tree. (Hosts and services must be online to display vital signs.)
- Click Vital Signs on the toolbar. Depending on what you select, you can see:
- Nuance Network: System CPU and memory-use statistics for all hosts in the network, and audio cache hits for the Nuance Speech Server.
- Cluster: System CPU and memory-use statistics for all hosts in the cluster.
Note: The vital signs displayed for the network and cluster scopes are the same. The values reflect the current scope. See Network and cluster vital signs.
- Host: CPU and memory-use statistics for that host. See Host vital signs.
- Service: CPU and memory-use statistics for that service. These vital signs are common to all services. The Speech Server display additional vital signs. See Service vital signs.
- Click Vital Signs on the toolbar. Depending on what you select, you can see:
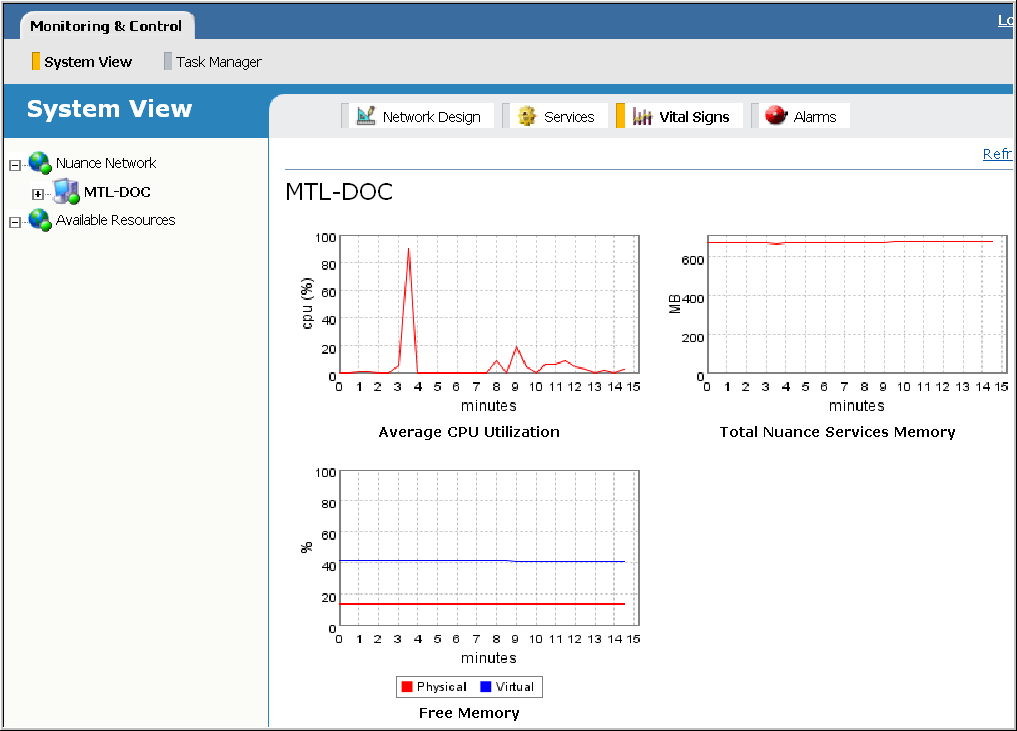
The Management Station charts the vital signs over a running 15 minute window and updates the display every 30 seconds. For example:
The vital signs displayed at the network and cluster scopes are:
|
Vital sign |
Description |
|---|---|
|
System |
|
|
Minimum Free Physical Memory |
The minimum amount of available physical memory, in MB. The Management Station determines the free physical memory on each host in the network or cluster and displays the lowest value. |
|
Minimum Free Virtual Memory |
The minimum amount of available virtual memory, in MB. The Management Station determines the free virtual memory on each host in the network or cluster and displays the lowest value. |
|
Average CPU Utilization |
The average CPU utilization of all hosts in the network or cluster, expressed as a percentage. |
|
Nuance Speech Server |
|
|
Audio Cache Hits |
The number of times the Speech Server retrieves audio files from the cache, expressed as a percentage. |
The vital signs displayed at the host scope are:
|
Vital sign |
Description |
|---|---|
|
Average CPU Utilization |
The average CPU utilization of the host, expressed as a percentage. |
|
Total Nuance Services Memory |
The total amount of memory, in MB, used by Nuance services configured on that host. |
|
Free Memory |
The amount of available free physical and virtual memory on that host, expressed as a percentage. |
The vital signs displayed at the service scope are:
|
Vital sign |
Description |
|---|---|
|
System (all services) |
|
|
CPU Utilization |
The average CPU utilization of the service over the last minute, as a percentage of total CPU usage. |
|
Memory Utilization |
Service memory use, in MB. |
|
Nuance Speech Server |
|
|
Average Audio Cache Hits |
The number of times the Speech Server retrieves audio files from the cache, expressed as a percentage. |
Note: By default, vital signs are stored only in memory. See Managing vital signs.
The Management Station automatically updates the vital signs’ display every 30 seconds. To change this rate, set VitalSignUpdateRateMs in %MSTATION_HOME%\mserver\webapps\mserver\config\mserver_cfg.properties. You might want to do this to reduce traffic on the network.
The value is expressed in milliseconds, so to have a refresh rate of once every 60 seconds, you would change the setting from 30000 to 60000. For example:
# Vital Signs Properties
VitalSignUpdateRateMs=60000
You can also disable automatic updating of vital signs at the network, host, or service level. You might want to do this to reduce traffic on the network. Just set the particular property (or properties) to false in the same file:
- UpdateNetworkLevelVS
- UpdateHostLevelVS
- UpdateServiceLevelVS
Restart the Management Station for the changes to take effect.
